Analyses and Results
We accounted for various levels of health centres in the Gulu District. We did separate catchment area analyses for each group of service levels, and one for overall access (see Fig. 1, 2, 3, Level II access maps not included). Most of our analyses were focused on our study area, eight parishes near the Northeast corner of Gulu District.
We ensured to extend our analysis outside of Gulu District slightly, as some patrons may find their nearest health centre outside the boundaries of the study area (see Fig. 4). These health centres were included to help reduce the 'edge effect' and account for areas of influence outside technical political boundaries.
The District of Gulu is comprised of fifty different parishes and totals about 3300 km-squared in size. The household data we obtained from the Gulu-HDSS contained approximately 2800 households (8991 individuals) within eight parishes near the Northeast corner of the District. These parishes are Punena, Gwendiya, Pukony, Paduny, Paibona, Kal-Amu, Kal-Alii, Labworumor. Through this, we could provide a more local-level, nuanced representation of malnutrition patterns and health care accessibility within the District.
From our household data, we geolocated each individual based on 'INDIVID_ID' within a household so we were able to more accurately represent the number of individuals and intricacies within the study area.
We found that accessibility to health centres within the Punena, Gwendiya, Pukony, Paduny, Paibona, Kal-Amu, Kal-Alii, and Labworumor parishes was reasonable. Approximately 80% of individuals (7178 of 8991) registered at Gulu-HDSS provided to us for this study were within a one hour or four kilometre distance of any health centre ranging from levels II-IV.
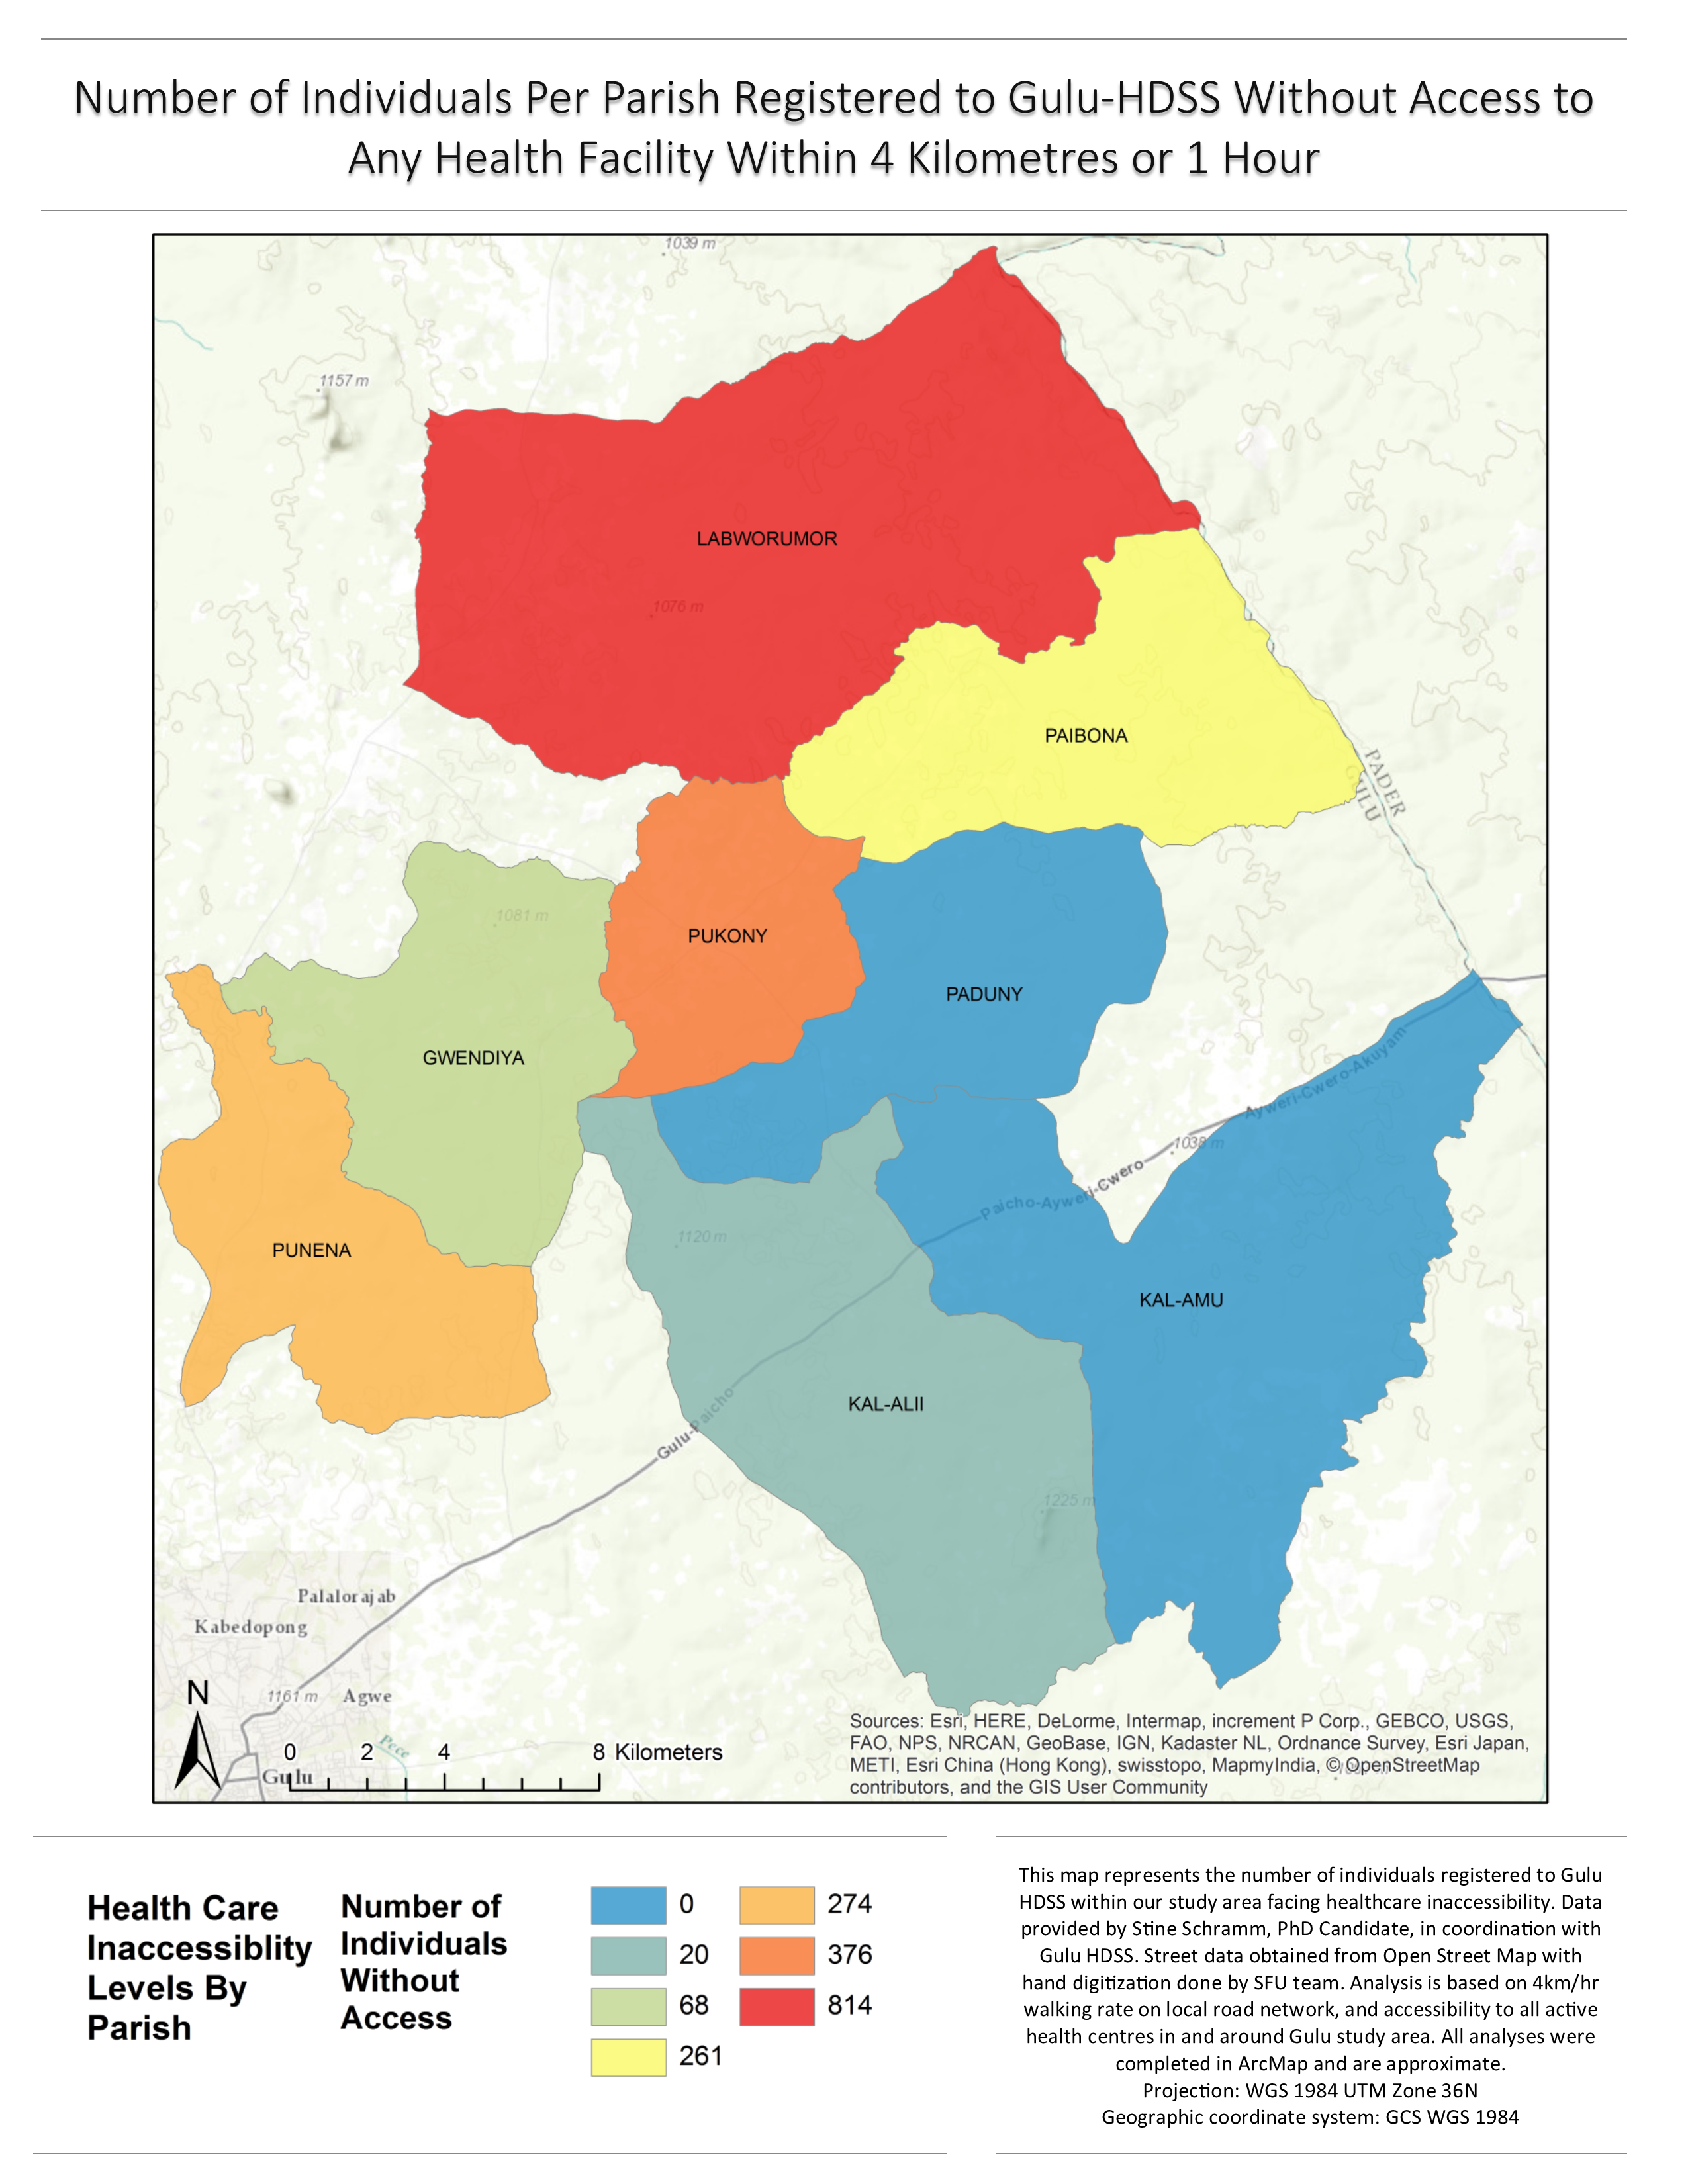
1813 people did not have access to any health facility within one hour. Labworumor parish had the majority of people with healthcare inaccessibility, with 814, the second most was the Pukony parish, with 376, then the Punena parish, with 274, the Paibona parish with 261, the Gwendiya parish with 68, and lastly, the Kal-Alii parish with 20 people facing healthcare inaccessibilities. All the residents in Kal-Amu and Paduny parishes registered at Gulu HDSS had a healthcare centre accessible within one hour or less (see Fig. 5 and 6).
Hospital and Level IV Service health facilities provided the smallest catchment areas, as they were only present in two parishes; Pukony and Gulu City. The majority of Gulu HDSS-registered individuals did not have access to these facilities (see Fig. 3).
Within our kernel density analysis of underweight and stunting, Pukony, Labworumor, and Punena had the highest number of individuals per square kilometre facing malnourishment. These clusters do show some spatial correlation with our kernel density map of healthcare inaccessibility. The hotspot version examining the same variables shows less of this spatial correlation than the kernel density estimation (maps not included for data privacy reasons).
Our seasonally-adjusted BMI hotspot analysis shows the pattern of low BMI scores as reasonably spread across the whole study area, with slightly more incidences in the Gwendiya and Pukony parishes. This map shows some significant clusters around areas of the parishes facing healthcare inaccessibility (southeast end of Punena parish, north end of Pukony), but the correlation is less clear than in the kernel density analysis of underweight and stunting (maps not included for privacy reasons). The WFL and HFA hotspot maps do not really point to any significant correlation between travel time and indicators of malnutrition (maps not included for privacy reasons).
Fig. 5. Kernel Density Analysis of Healthcare Inaccessibility in Study Area Parishes.
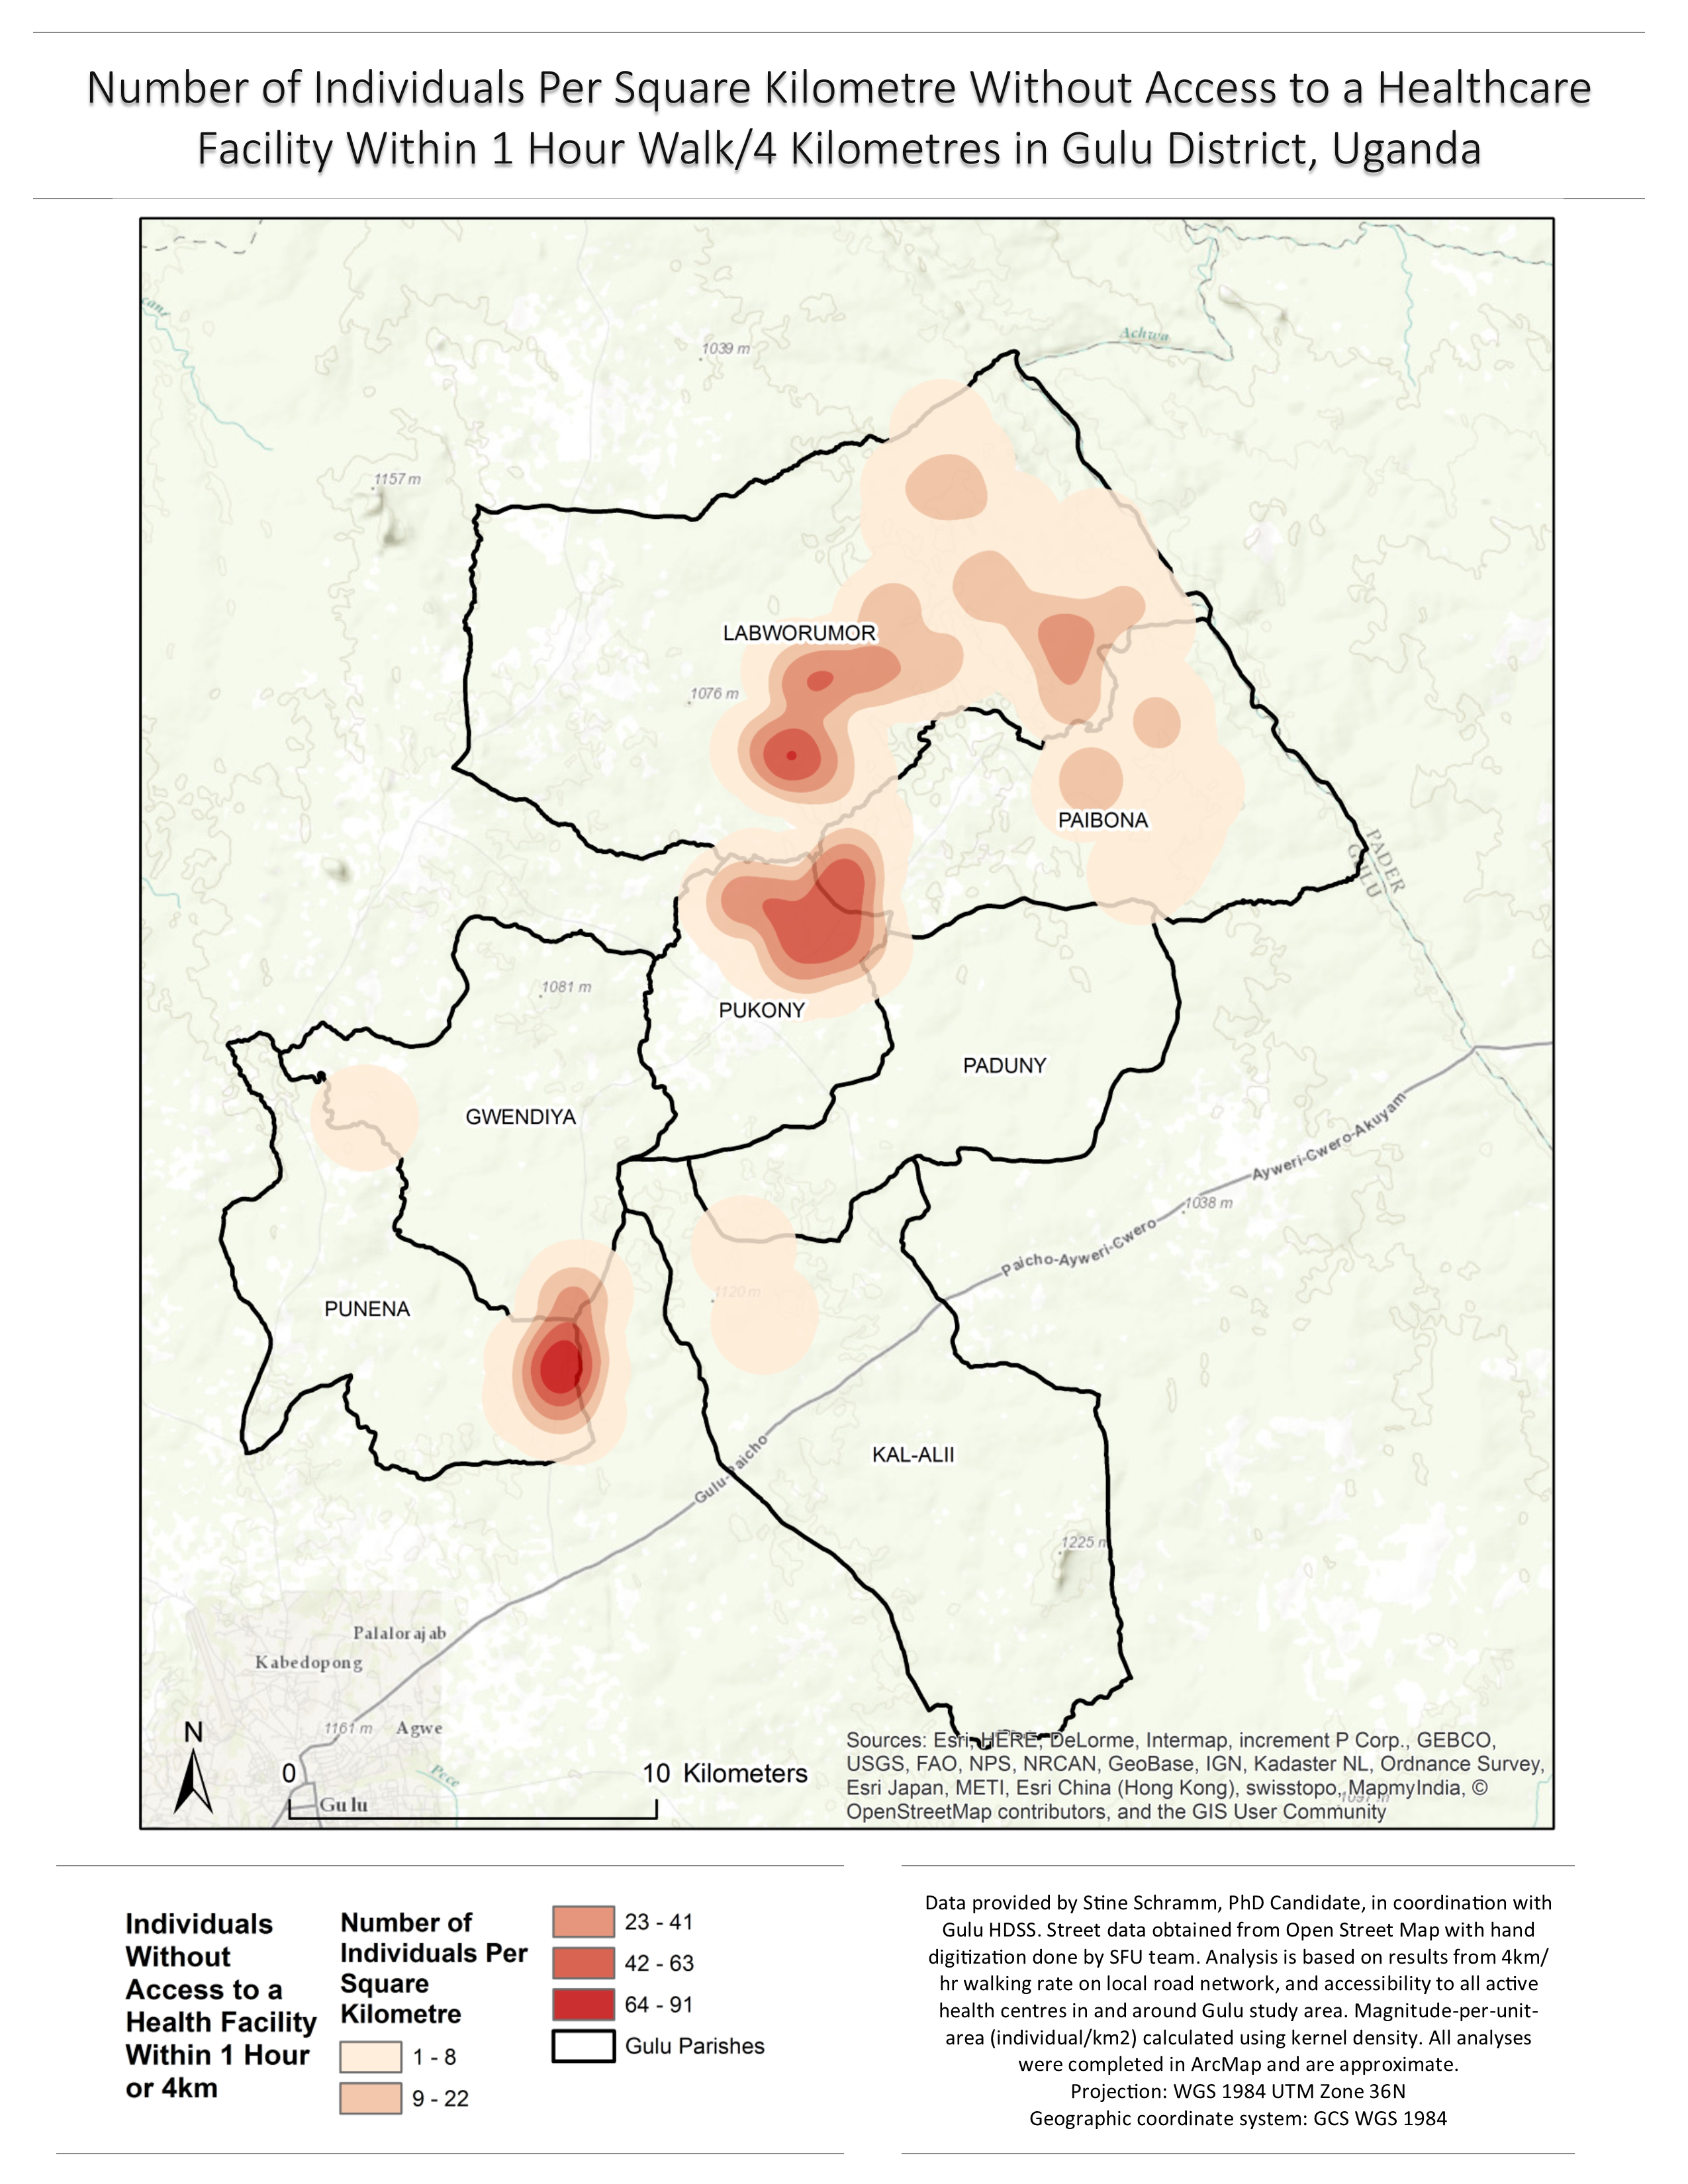
Fig 1. Accessibility to All Levels of Health Care Facilities in Gulu By Walking Time.
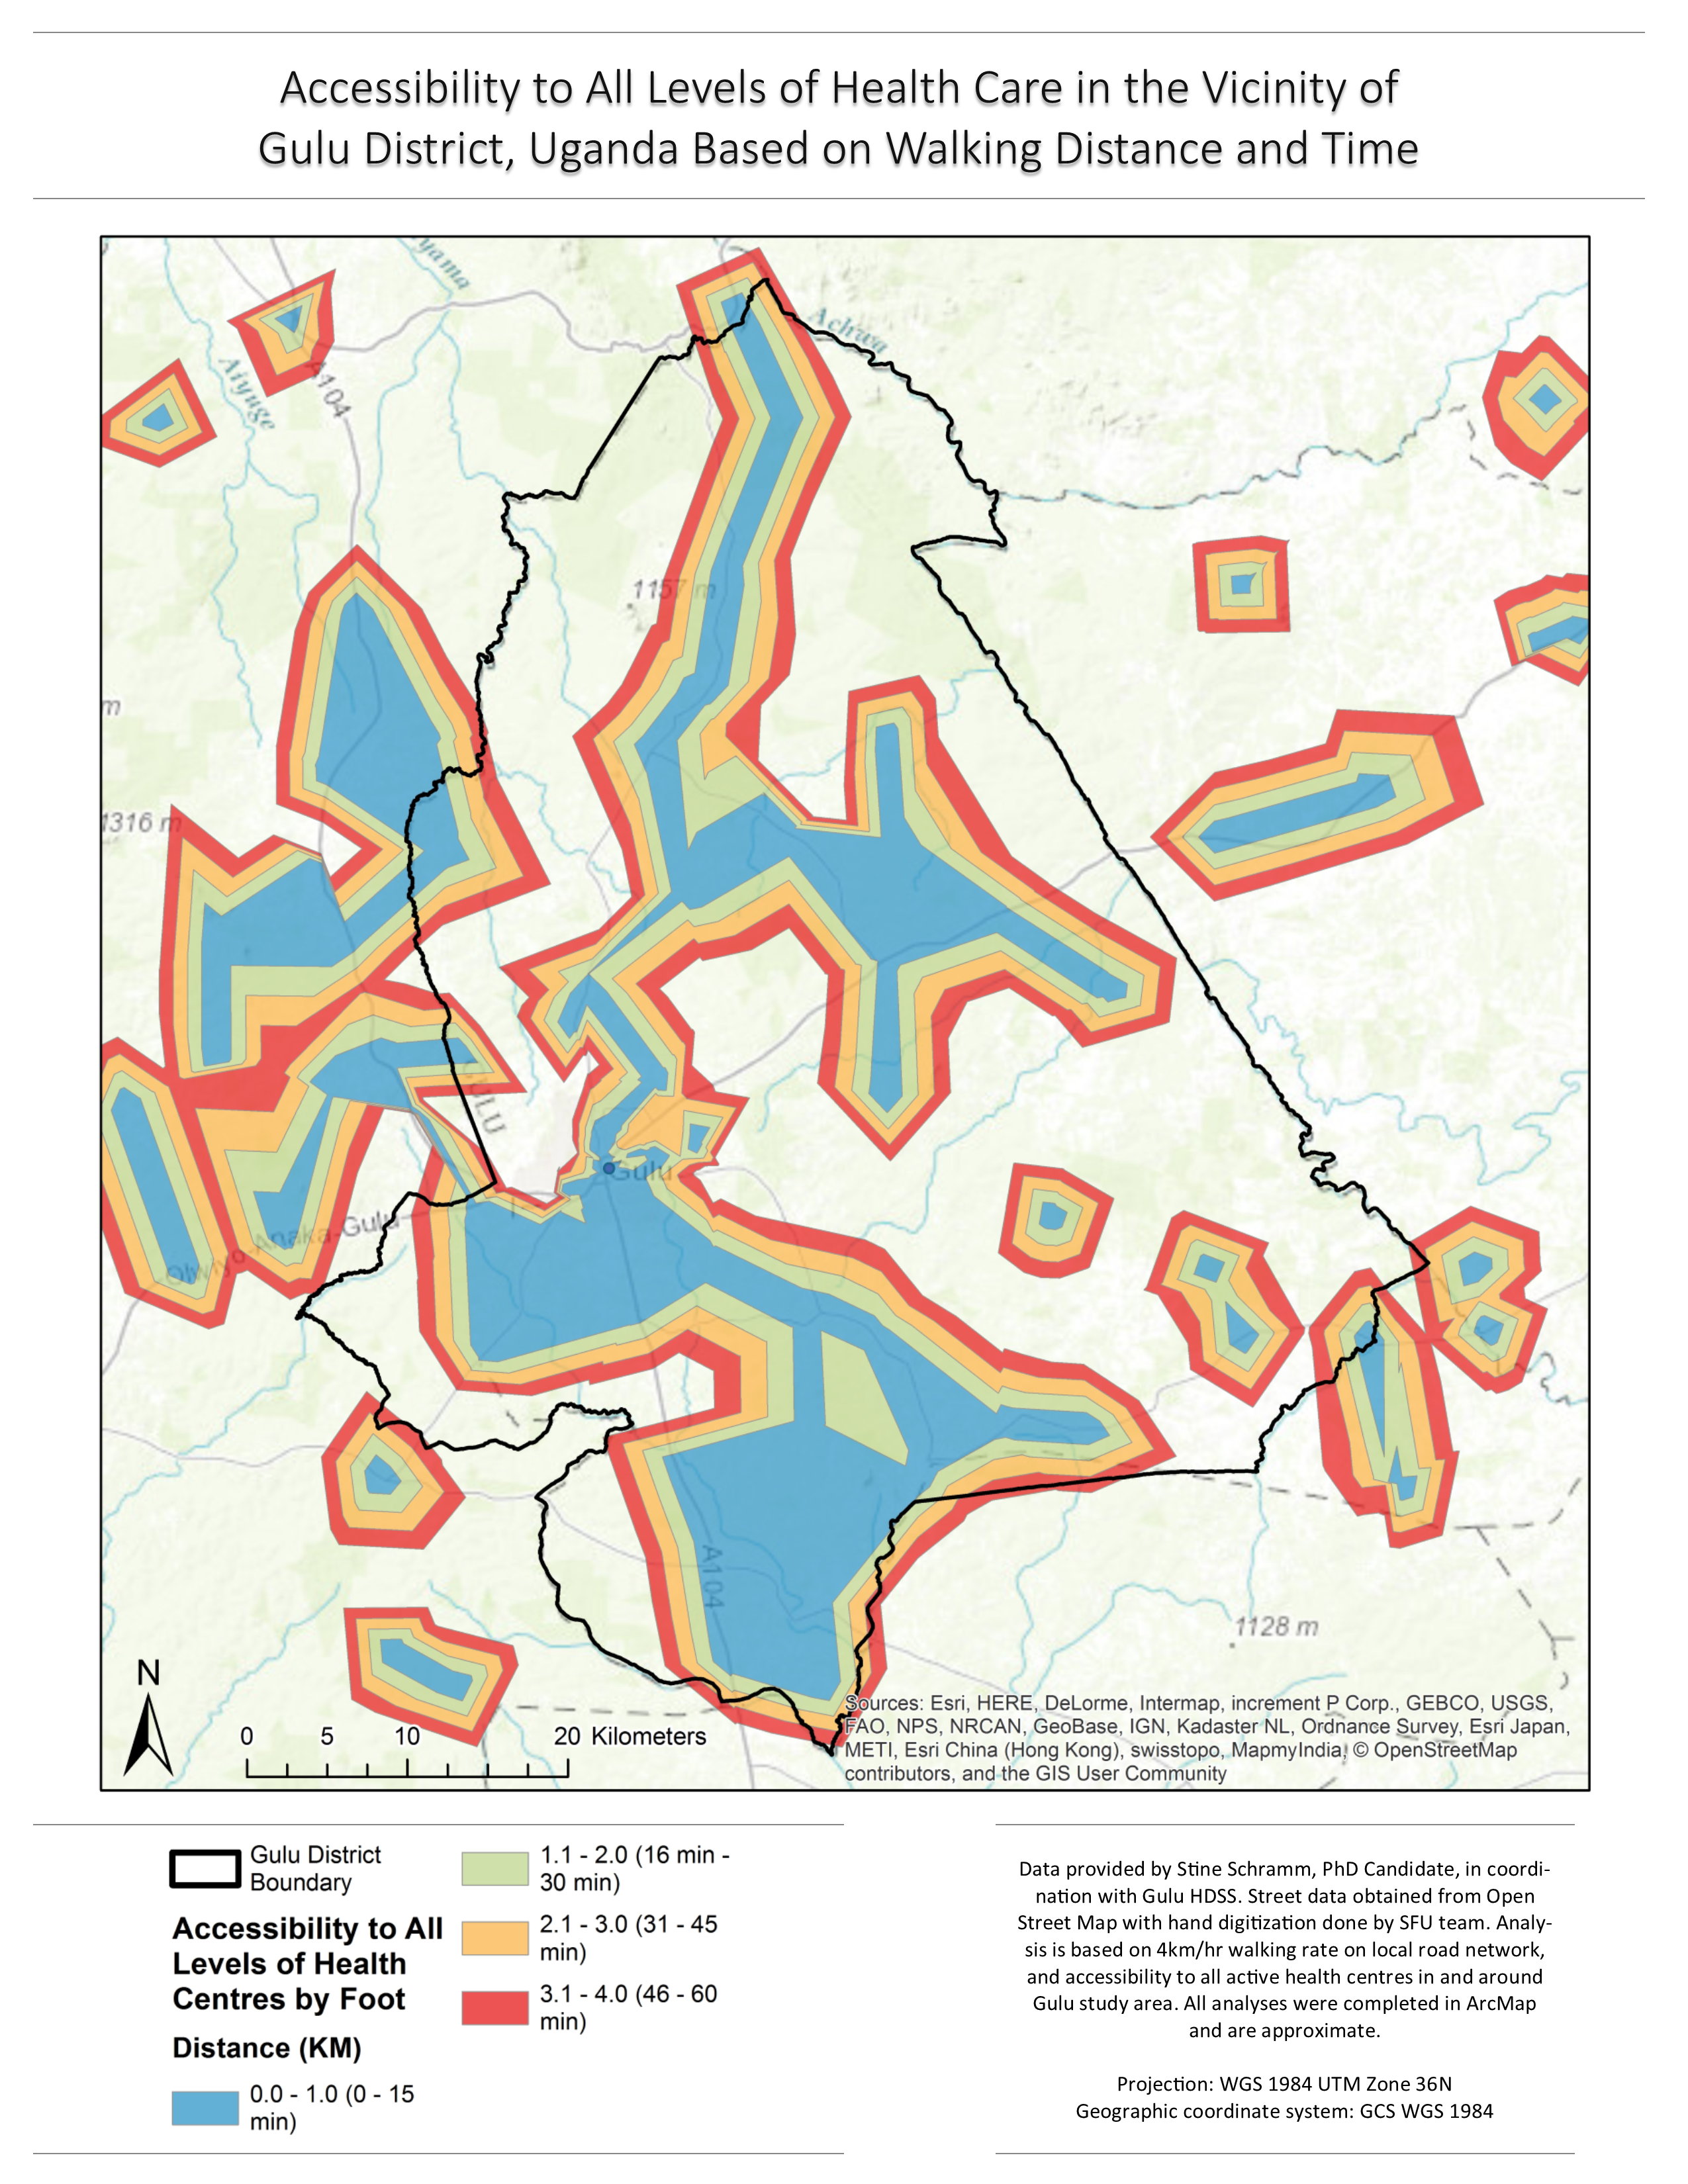
Fig 2. Accessibility to All Levels of Heath Care Facilities in Study Area Parishes by Walking Time.
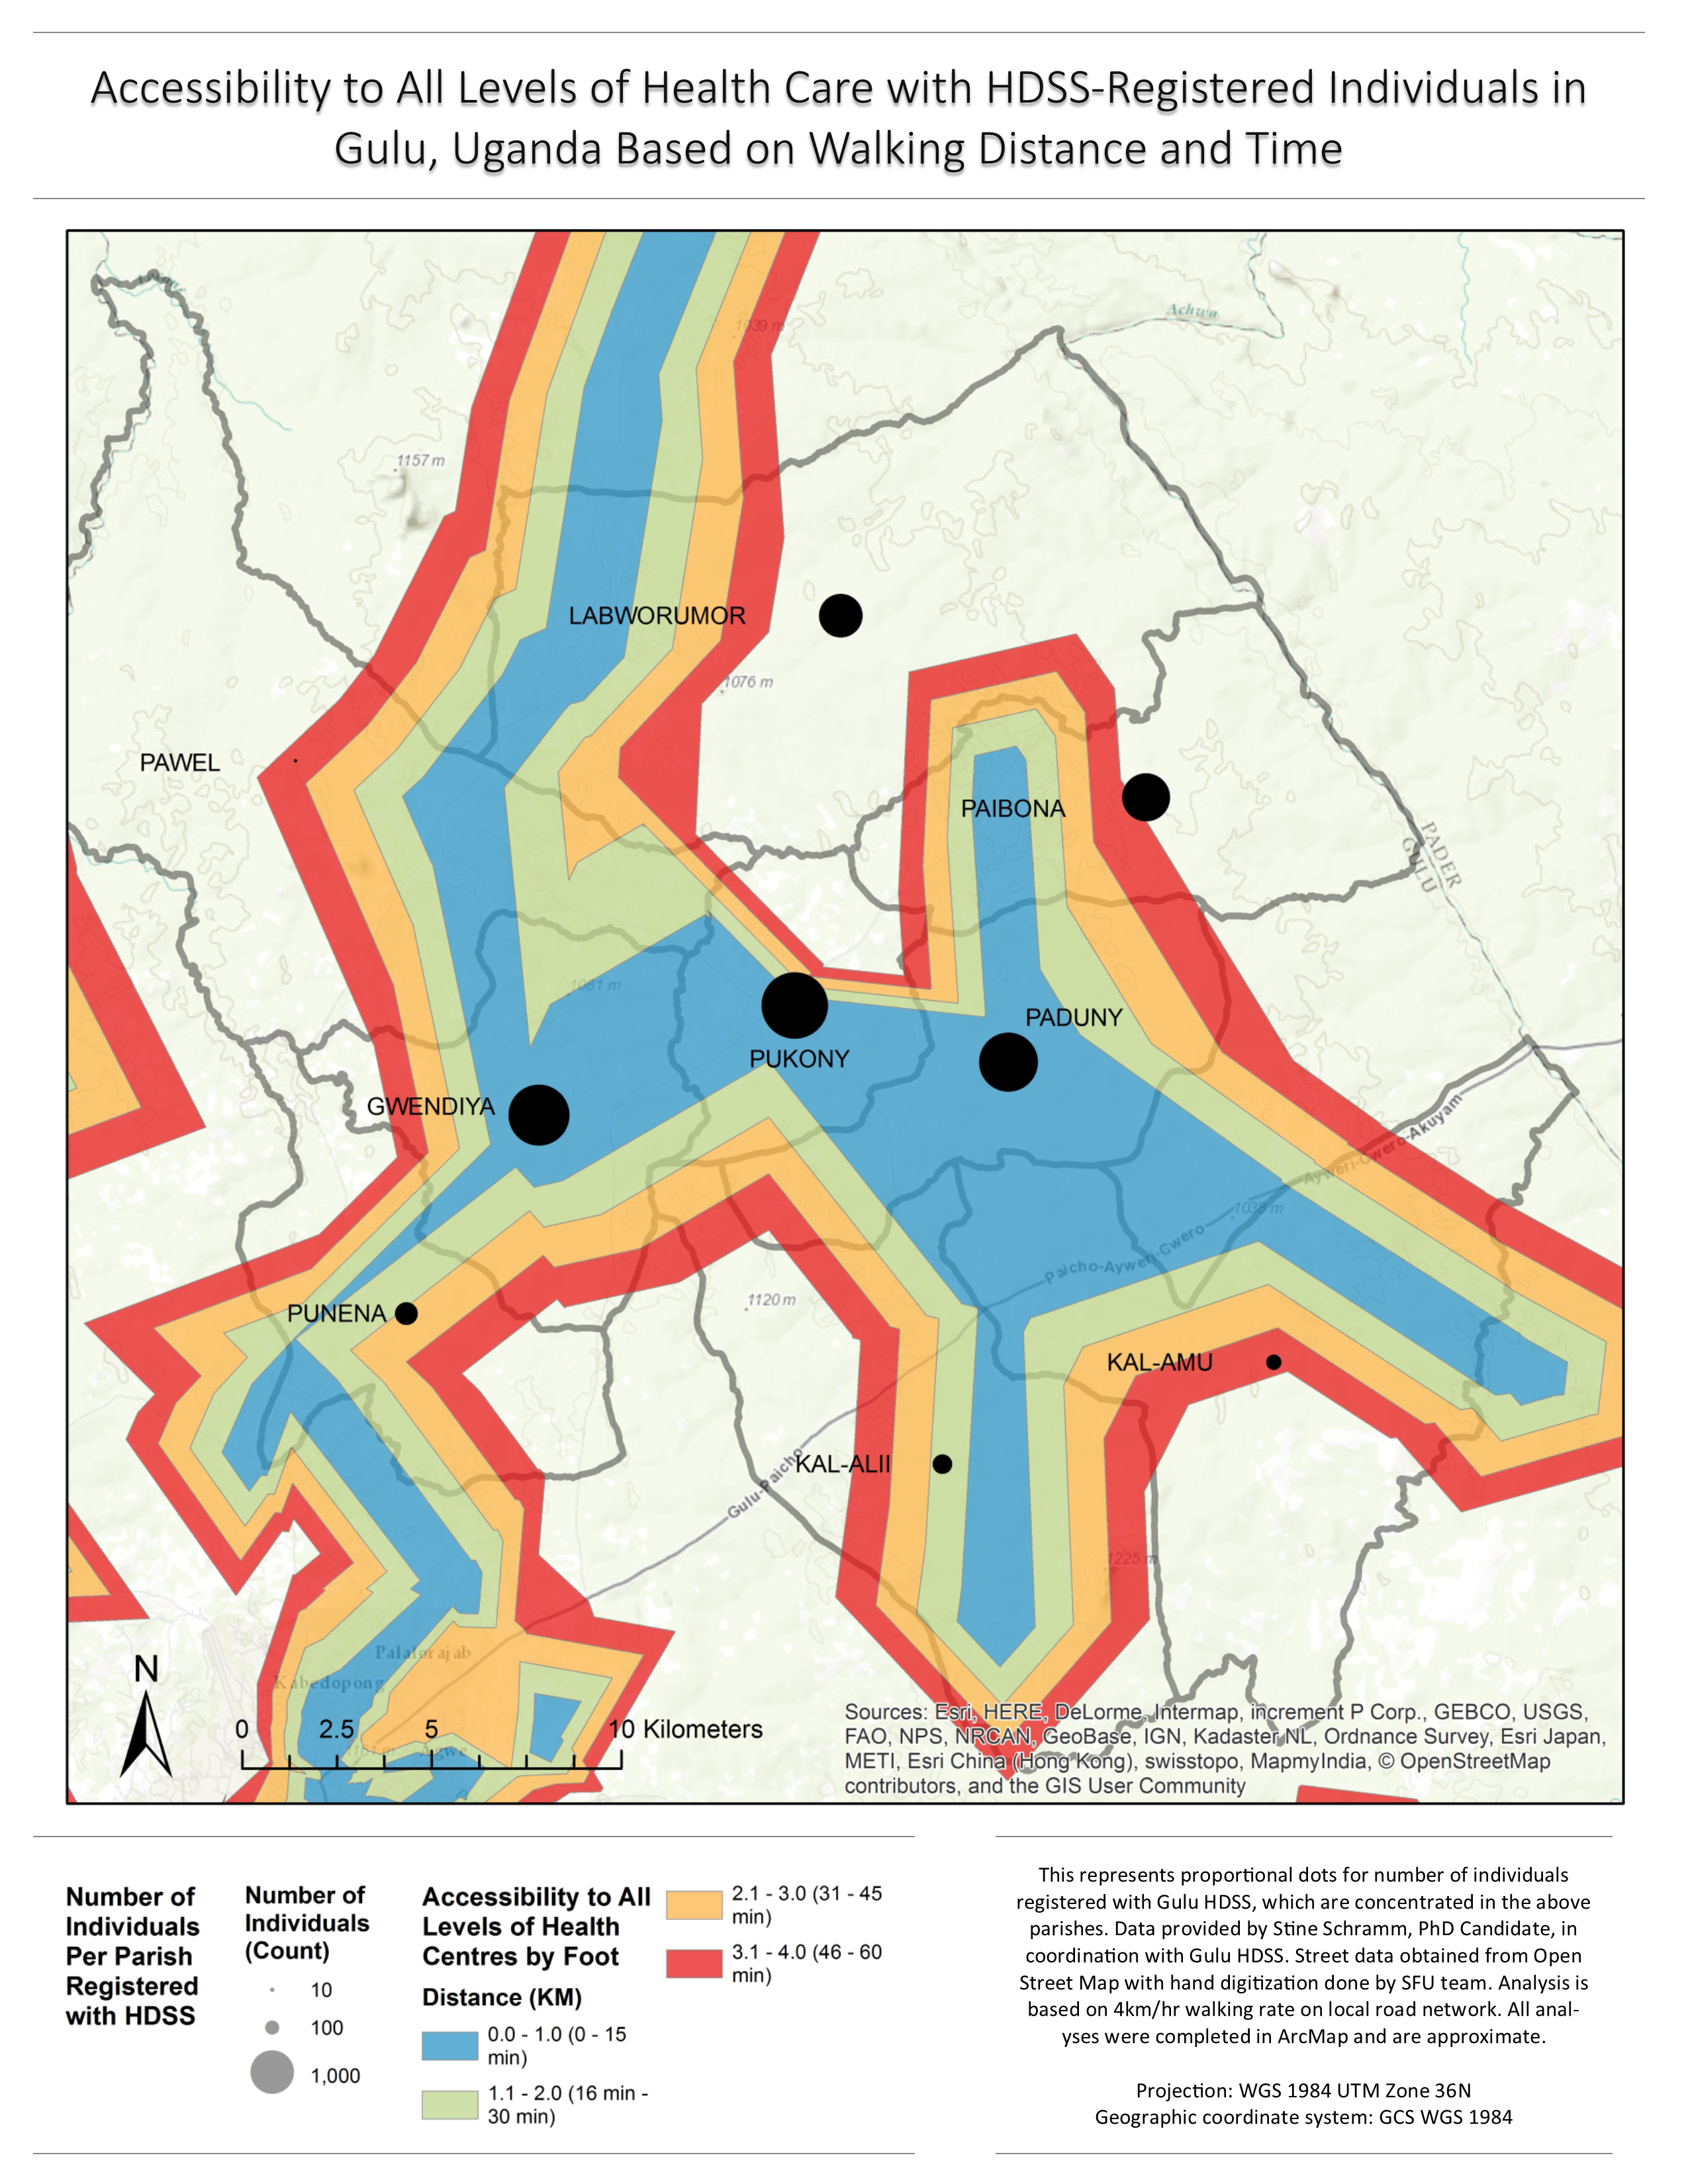
Fig 3. Accessibility to Level IV and Hospital Facilities in Study Area Parishes by Walking Time.
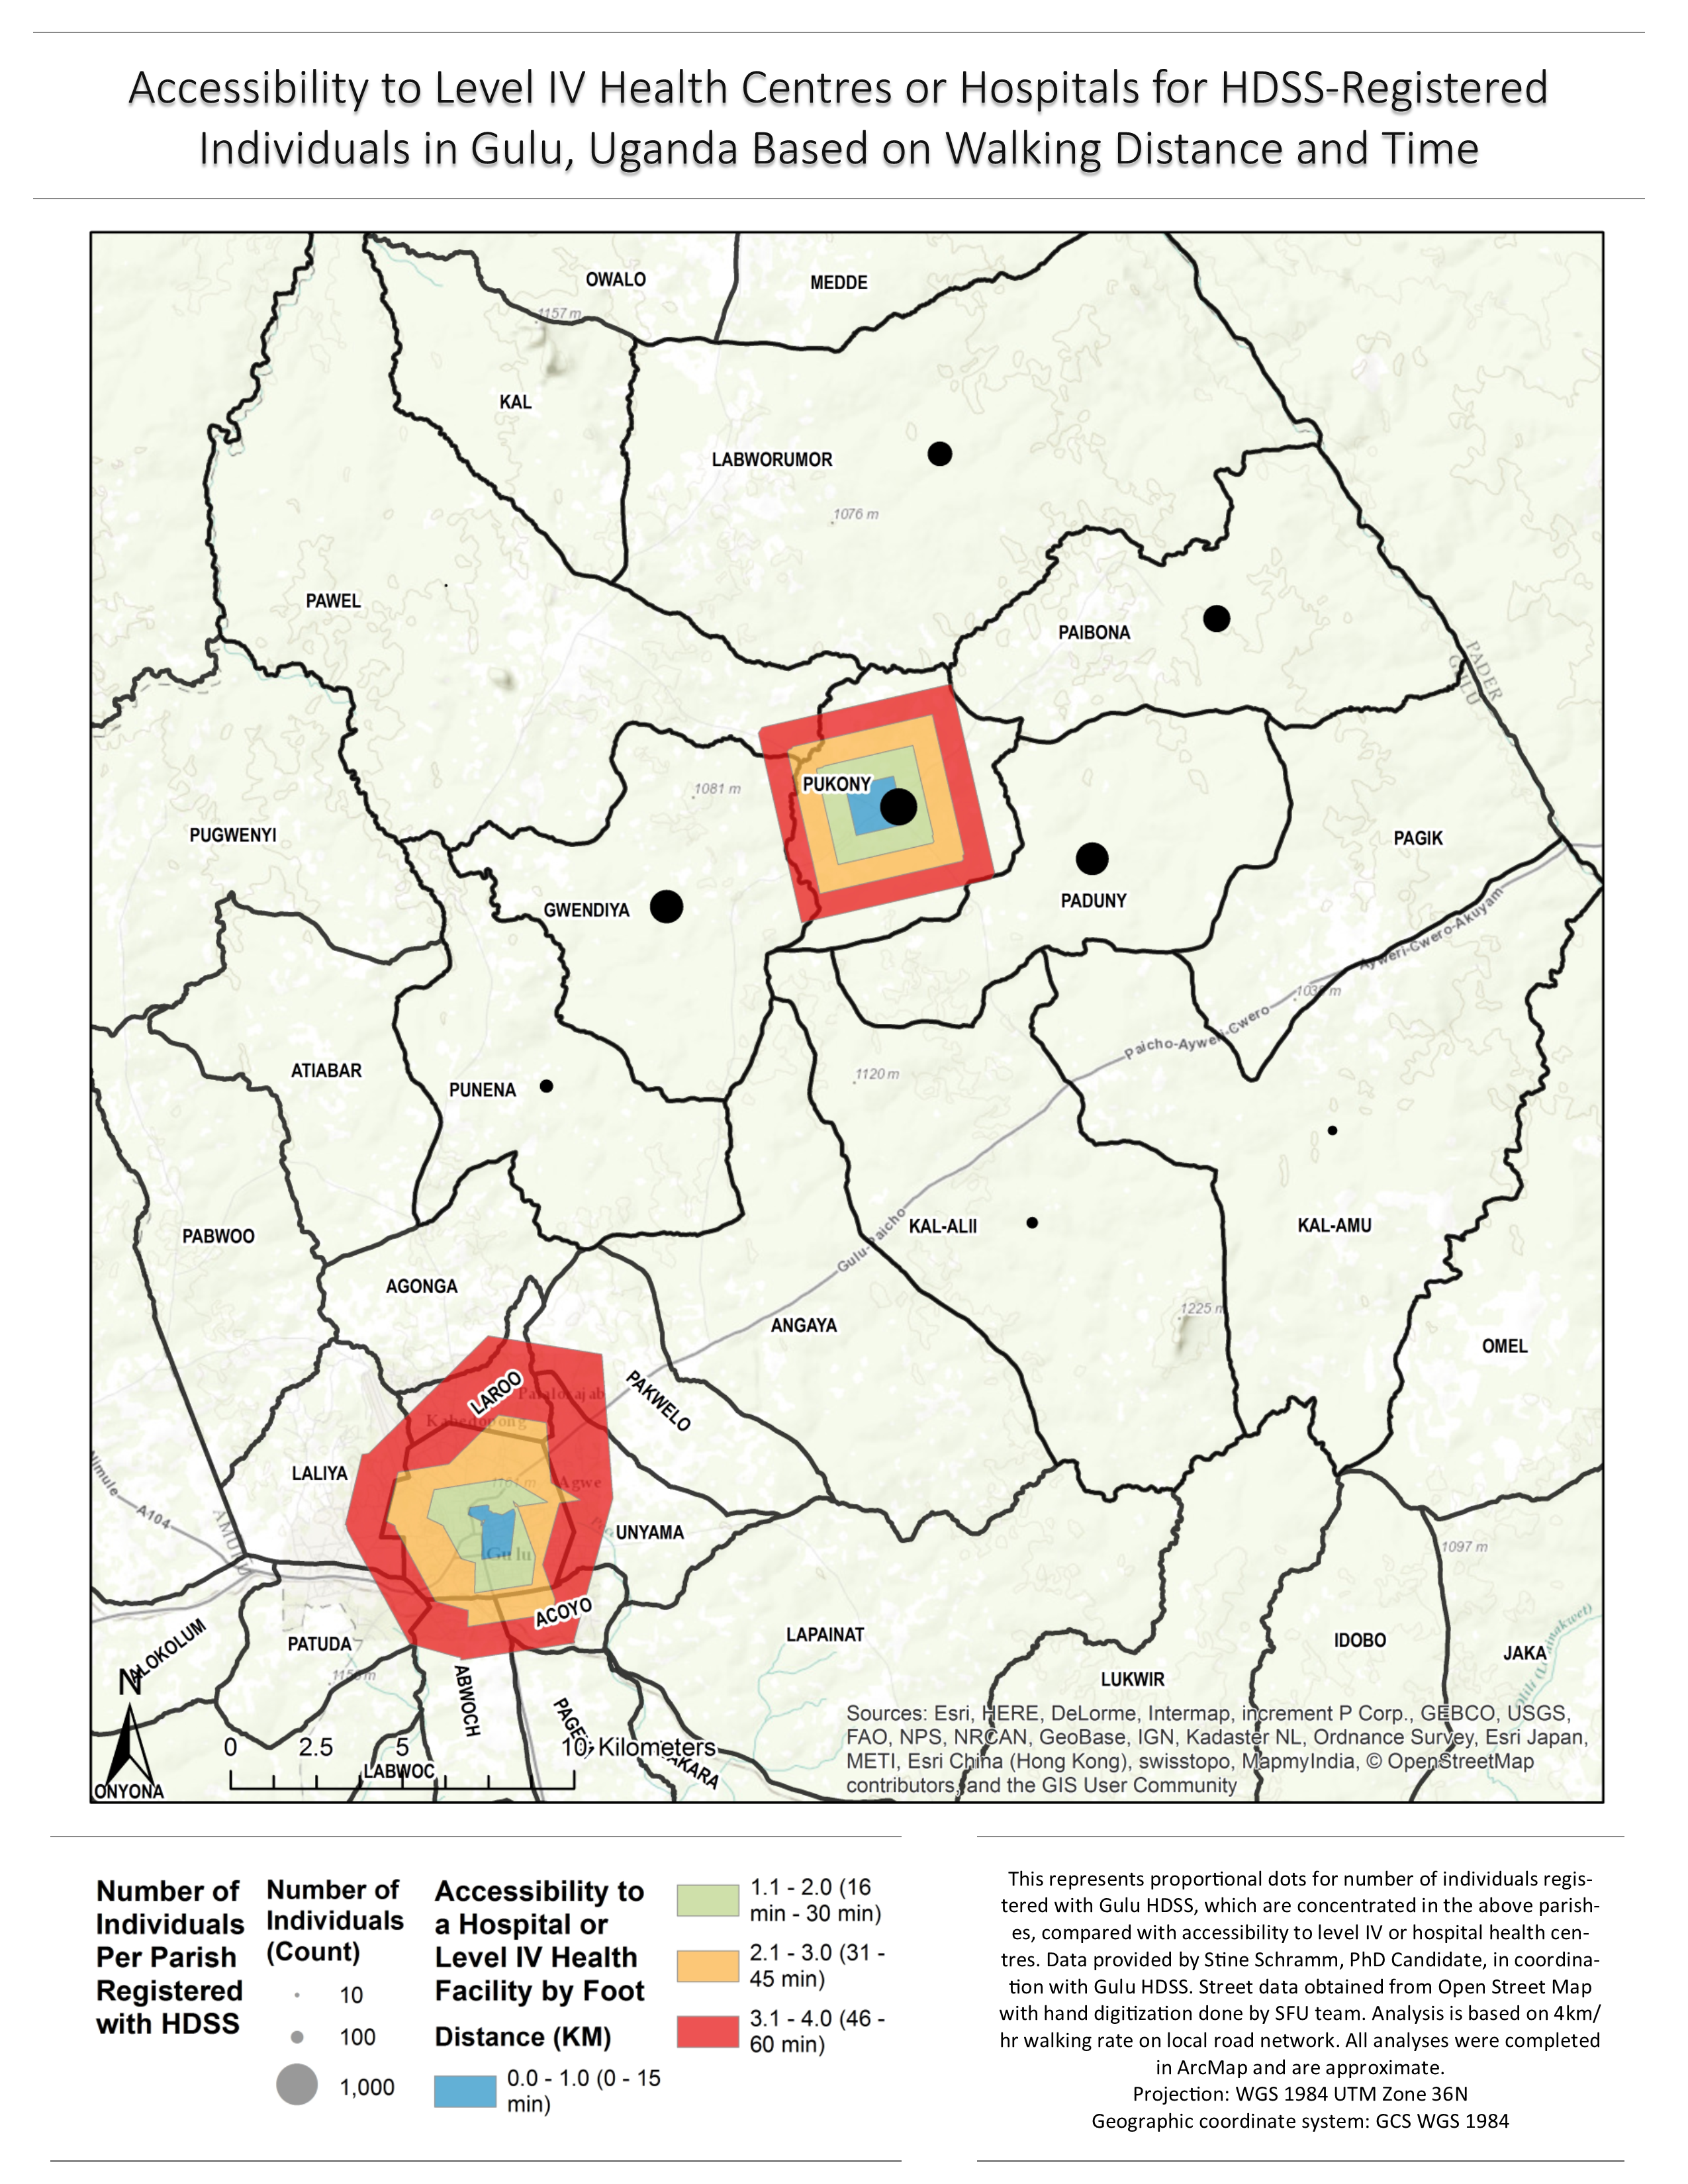
Fig 4. Health Centres Included as Facilities in Network Analysis
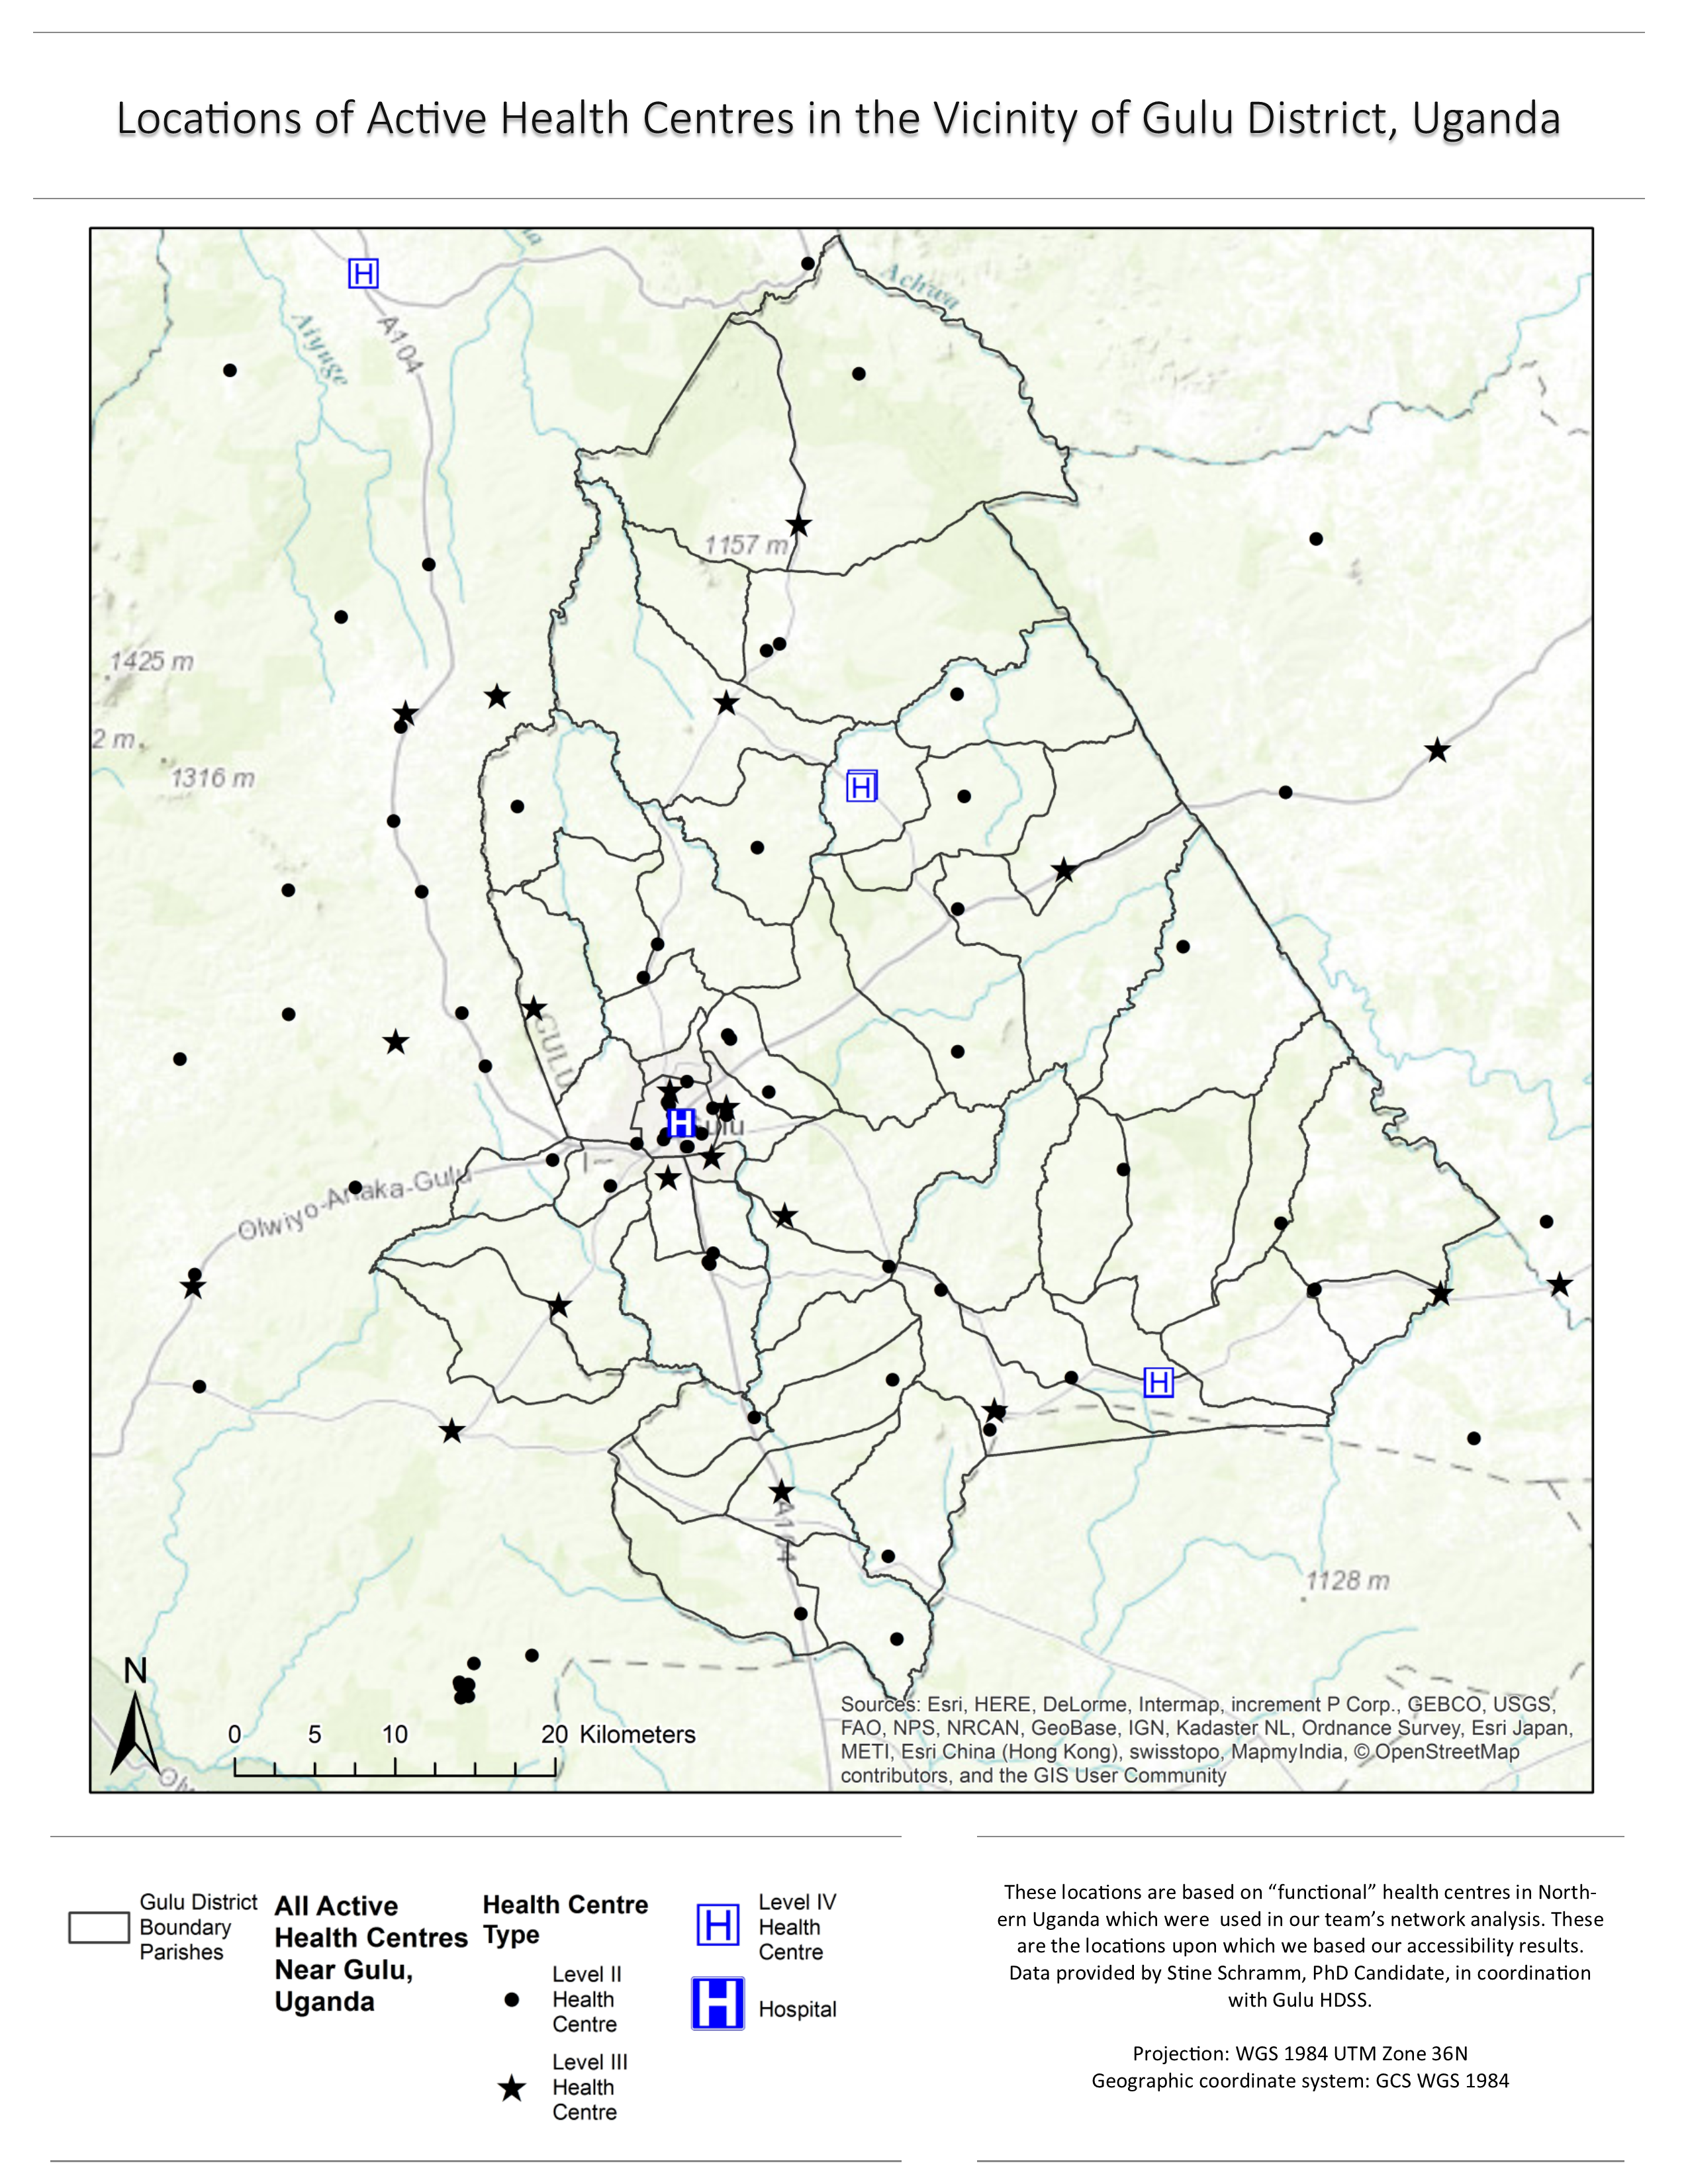
Fig. 6. Choropleth Map of Healthcare Inaccessibility in Study Area Parishes.